Petaluma in 2026 so far: fewer sales, a steady median, and bigger houses doing the lifting
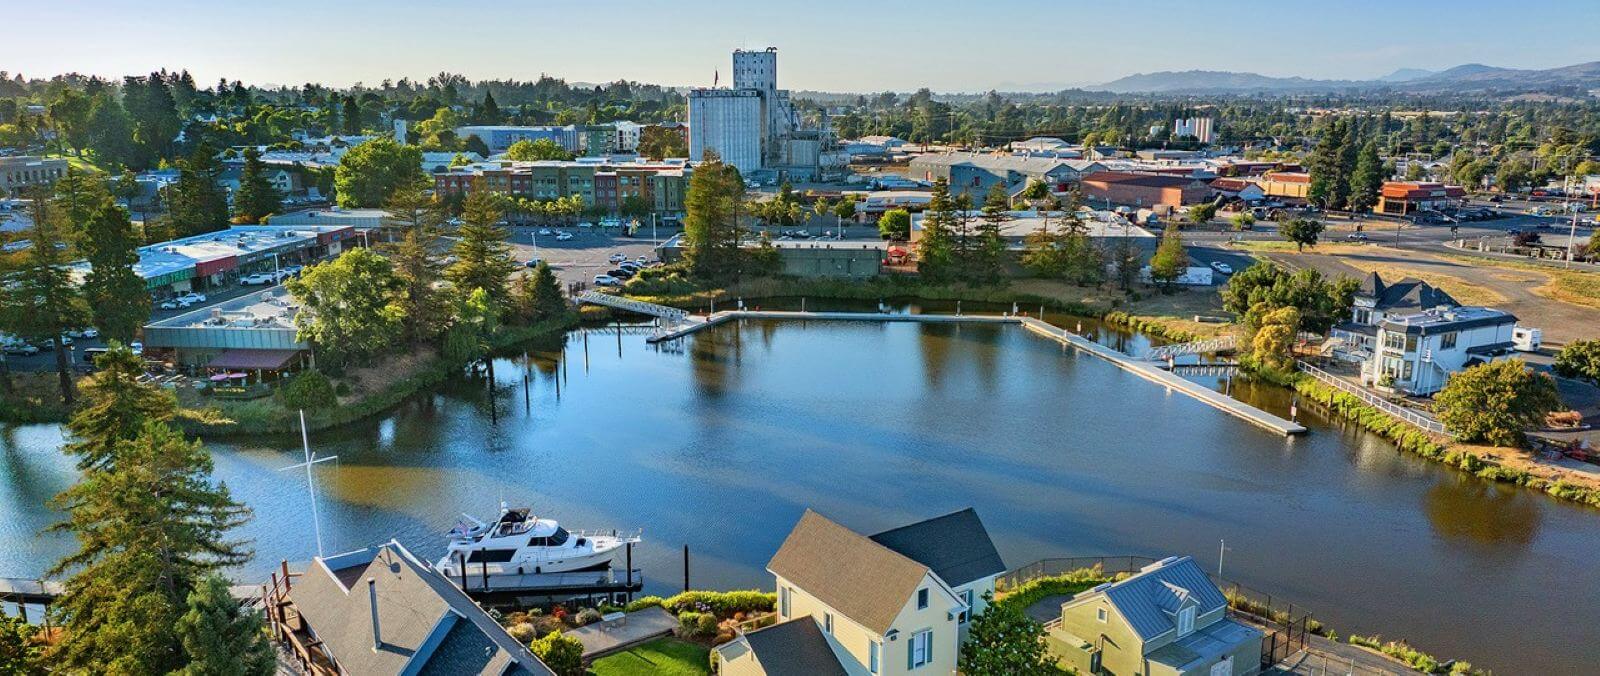
Petaluma recorded 282 single-family home sales between January 1 and September 23, 2026 — 14% fewer than the 328 over the same dates in 2025, and close to the 277 of 2024. The median sale was $981,000, up 0.7% on 2025.
That steady median needs a second look. The median home that sold this year was 1,882 square feet, 5.8% larger than last year's 1,779. Per square foot, the median fell to $560, from $573 in 2025 and $589 in 2024. Petaluma's headline price held because bigger houses made up more of what sold, not because the same house cost more.
Single-family, three years side by side
Same window each year: January 1 to September 23.
| 2024 | 2025 | 2026 | |
|---|---|---|---|
| Recorded sales | 277 | 328 | 282 |
| Median sale price | $950,000 | $974,000 | $981,000 |
| Middle half of sales | $800,000 – $1,250,000 | $825,000 – $1,231,250 | $830,000 – $1,300,000 |
| Median price per square foot | $589 | $573 | $560 |
| Median home size | 1,728 sq ft | 1,779 sq ft | 1,882 sq ft |
| Share of sales at $1 million or more | 43% | 46% | 49% |
Almost half of this year's single-family sales closed at $1 million or more, up from 43% two years ago.
Where the fewer sales came from
| Price band | 2025 sales | 2025 share | 2026 sales | 2026 share |
|---|---|---|---|---|
| Under $750,000 | 43 | 13% | 38 | 13% |
| $750,000 – $1,000,000 | 133 | 41% | 106 | 38% |
| $1,000,000 – $1,500,000 | 100 | 30% | 90 | 32% |
| $1,500,000 and up | 52 | 16% | 48 | 17% |
Of the 46 fewer sales this year, 27 came out of the $750,000–$1 million band — the middle of the Petaluma market. The $1–1.5 million band accounts for 10 more, the band under $750,000 for 5, and the top band for 4.
Quarter by quarter
| 2025 sales | 2025 median | 2025 $/sq ft | 2026 sales | 2026 median | 2026 $/sq ft | |
|---|---|---|---|---|---|---|
| January – March | 85 | $1,030,000 | $566 | 63 | $1,050,000 | $550 |
| April – June | 137 | $950,000 | $596 | 129 | $970,260 | $562 |
| July – September 23 | 106 | $965,000 | $533 | 90 | $942,500 | $577 |
The slowdown was sharpest in the first quarter (63 sales against 85). The spring was close to last year's, and the summer quarter so far is running at 90 against 106 — with the median slightly lower but the price per square foot higher than a year ago, a reminder that each quarter's mix of homes moves these figures as much as prices do.
By bedrooms, 2026
| Bedrooms | Sales | Median sale | Median $/sq ft |
|---|---|---|---|
| 1 | 3 | $570,000 | $895 |
| 2 | 21 | $865,000 | $883 |
| 3 | 113 | $915,000 | $634 |
| 4 | 118 | $1,052,500 | $528 |
| 5 or more | 27 | $1,230,000 | $462 |
Three- and four-bedroom homes were 82% of the year's sales. Price per square foot falls steadily with size — a smaller home carries a kitchen, bathrooms and a lot on fewer square feet.
Condos and townhomes
30 sales this year against 24 in 2025. The median rose to $678,000 from $600,000, but the median price per square foot was $442 against $443 — the units that sold were larger (1,498 sq ft against 1,336). Per foot, flat.
The two ZIP codes
Only 144 of this year's 282 single-family sales carry a ZIP code in the records, so treat this as a sample rather than the whole market.
| 2025 sales | 2025 median | 2025 $/sq ft | 2026 sales | 2026 median | 2026 $/sq ft | |
|---|---|---|---|---|---|---|
| 94952 | 99 | $1,100,000 | $632 | 65 | $1,192,000 | $670 |
| 94954 | 114 | $917,500 | $527 | 79 | $898,000 | $510 |
Within that sample, the gap between the two ZIP codes widened: 94952 rose on both measures while 94954 eased.
What is for sale now
As of September 24 there are 47 single-family homes listed in Petaluma, at a median ask of $938,000 ($567 per square foot asking), plus 5 condominiums (median ask $585,000) and 3 townhomes (median ask $665,000).
Petaluma recorded 123 single-family sales from June through August — about 41 a month. At that pace, 47 listings is roughly 1.1 months of supply.
How to read these numbers
- Recorded closings, same window every year. Every figure uses sales with a recorded close date from the MLS, January 1 to September 23, so the three years compare like with like. September is a partial month.
- Single-family unless stated. Condominiums and townhomes are reported separately; multi-unit and unclassified properties are left out.
- ZIP codes are partial, as noted above.
- No days-on-market or sale-to-list figures. The platform's listing feed for Petaluma is new, so the date a listing first appeared in it is not the date it came to market, and asking prices are not on record for these closings.
- Supply is an estimate from the listings in the feed today against the summer's sales pace.
This is a summary of recorded sales, not an appraisal or an opinion of any home's value.
Jake Taylor · CA DRE #02070119
[email protected] · (707) 630-1001