Petaluma Posts $113.7M Quarter With a $3.4M Ceiling and a Median That Climbed $80K by September
The period at a glance
| Metric | Q3 2026 |
|---|---|
| Total closings | 109 |
| Total volume | $113,698,560 |
| Median sale price | $920,000 |
| Median price per sq ft | $543 |
| Median square footage | 1,701 |
| Median lot size | 6,000 sq ft |
| Price range | $399,000 – $3,400,000 |
| Median days on market | 26 (reported on 70 of 109 closings) |
List prices are on file for this period; the against-asking picture appears in the segment section below. Days-on-market figures are drawn from MLS records and were reported on 70 of the 109 closings — just under two-thirds — so the speed data should be read as directional rather than definitive.
The quarter opened and closed at the same median price per square foot — $536 in July, $535 in September — but the median sale price itself moved from $920,000 in July to $1,000,000 in September, a $80,000 gain driven largely by the mix of what closed in the final month rather than by broad price appreciation. August was the softer month on both measures: 32 closings, median price $891,000, median PPSF $572. The composition shift between months — larger, higher-priced homes settling in September — accounts for much of the swing. The $2M-and-above band, just four closings for the full quarter, contributed three of them in September alone.
The sales
The table below shows the top 40 closings by price. The full quarter recorded 109 transactions.
| Address | Segment | Beds | Sq Ft | $/Sq Ft | Closed | DOM | Sale Price |
|---|---|---|---|---|---|---|---|
| 9 Michelle Lane | Single Family | 4 | 2,627 | $1,294 | Sep 14 | — | $3,400,000 |
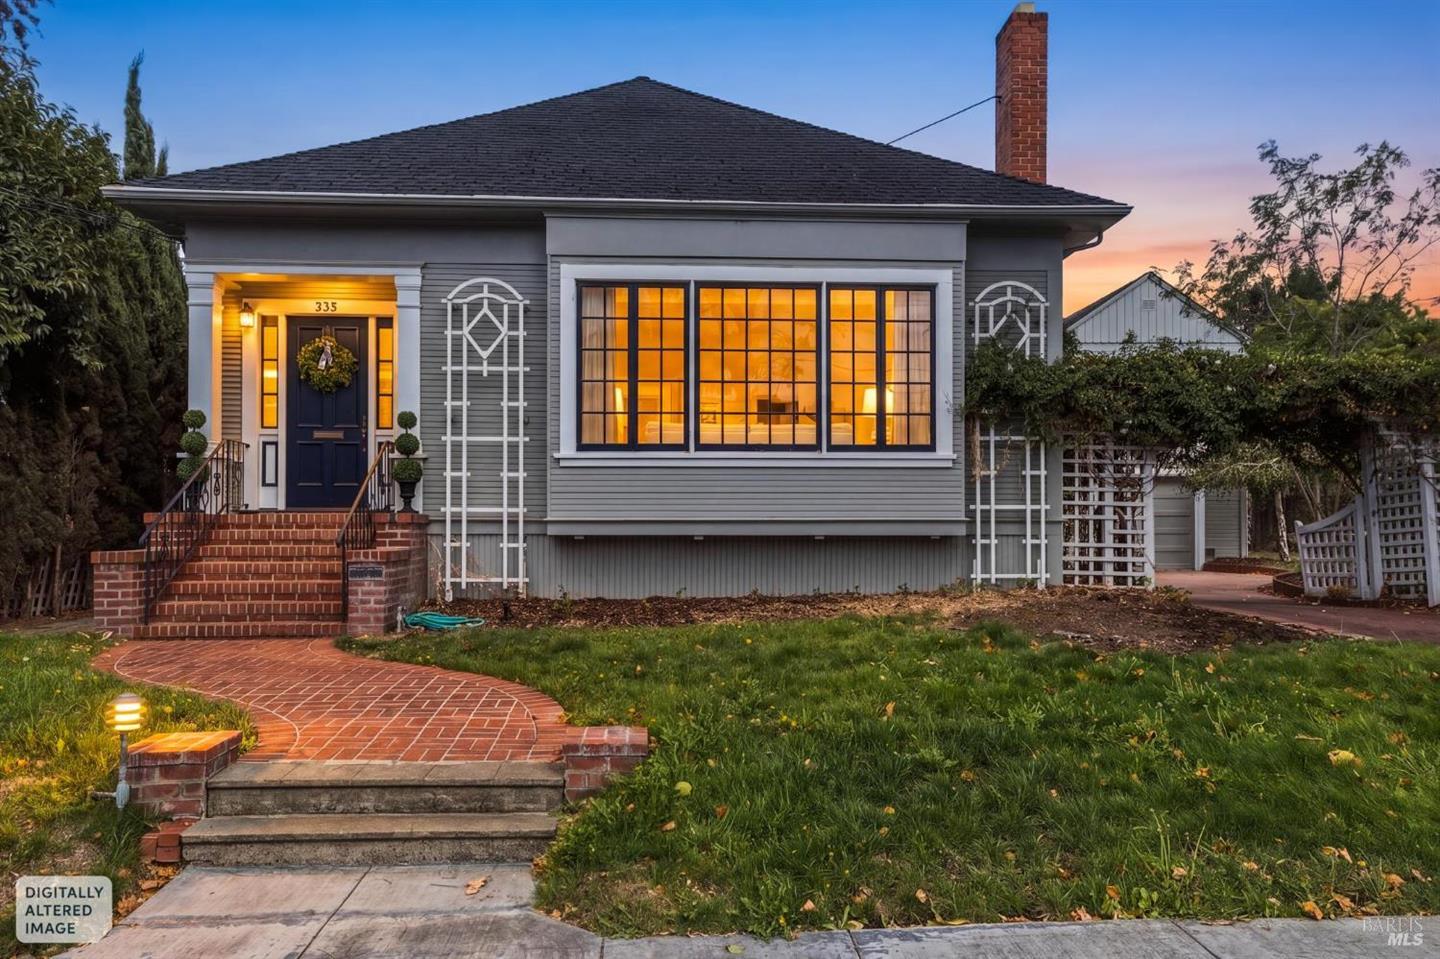
| 335 Bassett Street | Single Family | 3 | 2,449 | $868 | Sep 30 | — | $2,125,000 |
| 1100 Gossage Avenue | Single Family | 4 | 2,665 | $788 | Jul 30 | 30 | $2,100,000 |
| 3150 Pepper Road | Single Family | 3 | 2,286 | $919 | Sep 17 | — | $2,100,000 |
| 39 Barn View Ct | Single Family | 3 | 2,491 | $736 | Sep 30 | — | $1,832,655 |
| 2212 Magnolia Avenue | Single Family | 3 | 2,420 | $723 | Aug 31 | 91 | $1,750,000 |
| 614 E Street | Single Family | 3 | 1,281 | $1,331 | Sep 15 | — | $1,705,000 |
| 614 Deer Valley Court | Single Family | 5 | 2,811 | $606 | Sep 23 | — | $1,703,405 |
| 73 Aloha Court | Single Family | 5 | 3,196 | $524 | Sep 14 | — | $1,675,000 |
| 408 Cherry Street | Single Family | 4 | 2,563 | $644 | Aug 21 | — | $1,650,000 |
| 1121 F Street | Single Family | 4 | 1,781 | $912 | Jul 27 | 59 | $1,625,000 |
| 1108 E Sunnyslope Road | Single Family | 4 | 2,230 | $673 | Jul 20 | 23 | $1,500,000 |
| 500 Rohde Lane | Single Family | 3 | 1,875 | $800 | Aug 24 | — | $1,500,000 |
| 121 Belle View Avenue | Single Family | 4 | 1,557 | $934 | Sep 16 | — | $1,455,000 |
| 782 El Paseo Drive | Single Family | 4 | 2,896 | $492 | Jul 20 | 55 | $1,425,000 |
| 1000 E Sunnyslope Road | Single Family | 4 | 2,807 | $506 | Jul 22 | 7 | $1,420,000 |
| 705 5th Street | Single Family | 3 | 1,369 | $1,023 | Sep 28 | — | $1,400,000 |
| 2408 Magnolia Avenue | Single Family | 3 | 2,268 | $616 | Jul 17 | 45 | $1,397,000 |
| 4320 Roblar Road | Single Family | 3 | 1,938 | $720 | Jul 10 | 87 | $1,395,000 |
| 38 Mission Drive | Single Family | 4 | 2,614 | $507 | Sep 28 | — | $1,325,000 |
| 609 Tulare Street | Single Family | 4 | 2,470 | $526 | Jul 31 | 0 | $1,300,000 |
| 1026 Hidden Valley Drive | Single Family | 4 | 2,455 | $523 | Aug 11 | 43 | $1,285,000 |
| 1661 Andover Way | Single Family | 5 | 2,538 | $493 | Sep 19 | — | $1,250,000 |
| 547 Sapphire Street | Single Family | 5 | 2,650 | $462 | Sep 15 | — | $1,225,000 |
| 520 Almanor Street | Single Family | 4 | 2,703 | $448 | Jul 30 | 21 | $1,210,000 |
| 413 Redrock Way | Single Family | 5 | 2,698 | $448 | Aug 20 | — | $1,210,000 |
| 956 Phillips Avenue | Single Family | 2 | 1,658 | $724 | Sep 14 | — | $1,200,000 |
| 814 Cobbler Lane | Single Family | 4 | 2,265 | $530 | Jul 14 | 64 | $1,200,000 |
| 1417 Sylvia Way | Single Family | 5 | 2,402 | $489 | Jul 27 | 18 | $1,175,000 |
| 5 Starling Drive | Single Family | 4 | 2,204 | $522 | Jul 10 | 15 | $1,150,000 |
| 3 Vintage Court | Single Family | 4 | 2,330 | $479 | Sep 16 | — | $1,115,000 |
| 1804 Adobe Creek Drive | Single Family | 5 | 3,006 | $371 | Sep 28 | — | $1,115,000 |
| 2103 Bodega Avenue | Single Family | 3 | 1,100 | $968 | Jul 15 | 123 | $1,065,000 |
| 1908 Pico Street | Single Family | 4 | 2,750 | $385 | Aug 21 | — | $1,060,000 |
| 12 Nob Hill Terrace | Single Family | 3 | 1,339 | $792 | Sep 11 | — | $1,060,000 |
| 1759 Emma Way | Single Family | 4 | 2,333 | $450 | Sep 29 | — | $1,050,000 |
| 504 Ruby Street | Single Family | 4 | 2,174 | $483 | Aug 5 | 43 | $1,050,000 |
| 25 Linda Vista Terrace | Multiple on Lot | 4 | 2,632 | $399 | Sep 2 | — | $1,050,000 |
| 13 El Rose Drive | Single Family | 3 | 1,211 | $851 | Jul 23 | 8 | $1,030,000 |
| 1706 Gateside Drive | Single Family | 3 | 2,057 | $498 | Jul 13 | 18 | $1,025,000 |
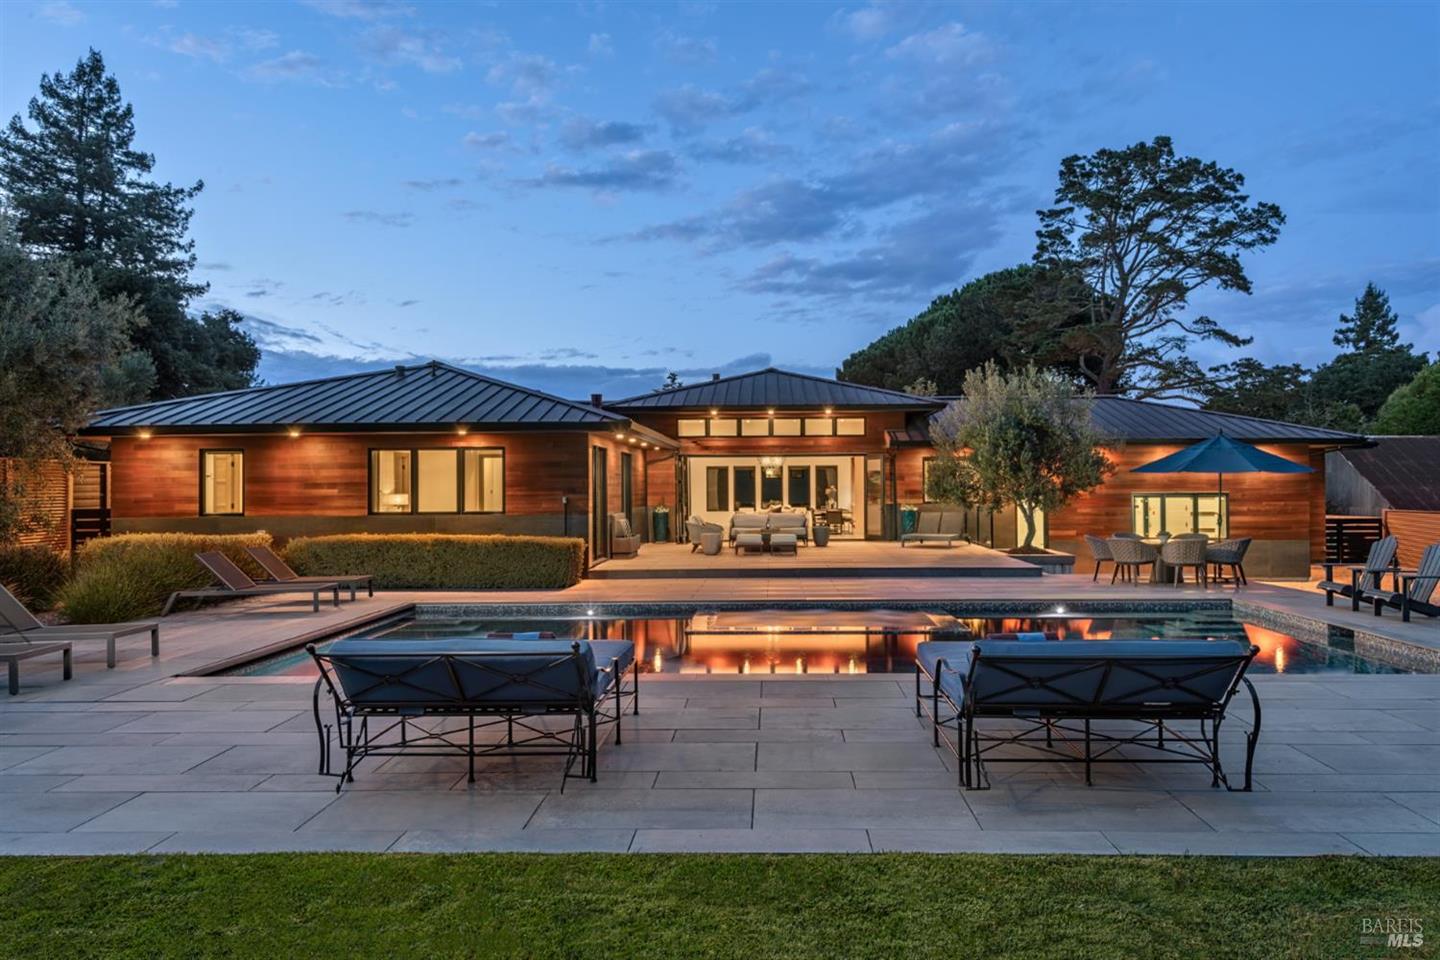
Four transactions deserve particular attention. The quarter's high-water mark was 9 Michelle Lane, a 2,627-square-foot home built in 2020 on a 18,870-square-foot lot, which settled at $3,400,000 — $1,294 per square foot, well clear of any other Q3 closing. No days-on-market figure was recorded for this sale.
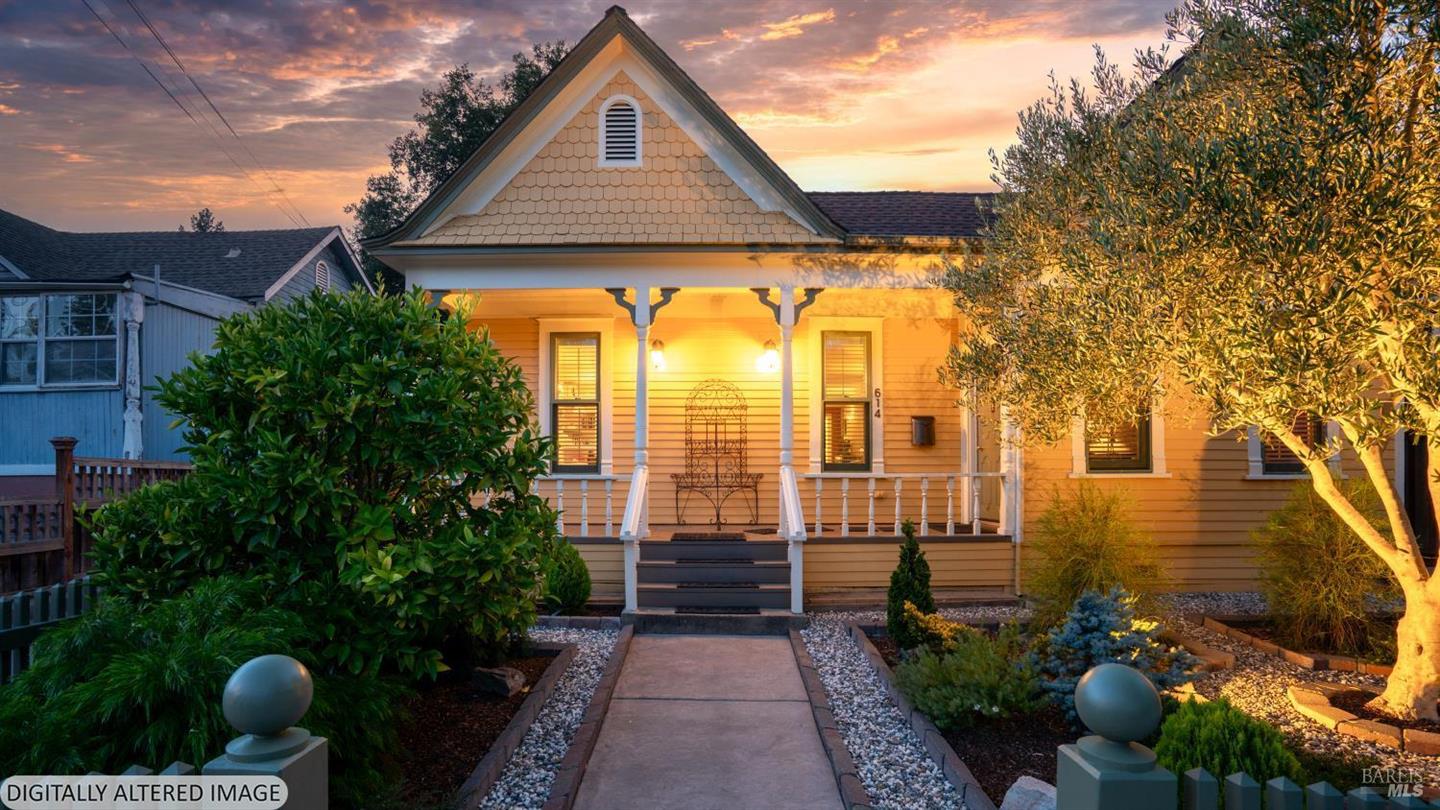
At the other end of the character spectrum: 614 E Street, a three-bedroom home built in 1880 and measuring just 1,281 square feet, closed at $1,705,000 — $1,331 per square foot, the highest rate in the roster. Small footprint, central location, and a pre-1900 build year produced the steepest per-foot number in the quarter.
2103 Bodega Avenue sits at the opposite end of the patience scale. The 1,100-square-foot single-family home on Bodega Avenue logged 123 days on market before closing at $1,065,000 — a PPSF of $968, not low by the quarter's standards, but one that clearly required time to find its buyer.
Contrast that with 609 Tulare Street: zero days recorded on market, four bedrooms, 2,470 square feet, and a $1,300,000 close. Whether that DOM figure reflects a pre-marketing sale or a recording gap is not determinable from the closing record alone.
Where the market split
By segment
| Segment | Closings | Median Price | Median PPSF | Median Sq Ft | Range |
|---|---|---|---|---|---|
| Single Family | 97 | $945,000 | $543 | 1,781 sq ft | $575K – $3.4M |
| Condominium | 6 | $784,500 | $543 | 1,433 sq ft | $399K – $925K |
| Townhouse | 4 | $734,500 | $568 | 1,304 sq ft | $500K – $850K |
| Multi-family | 1 | $840,000 | $571 | 1,472 sq ft | $840K only |
| Multiple on Lot | 1 | $1,050,000 | $399 | 2,632 sq ft | $1.05M only |
All medians above are drawn from the listed sample sizes. The multi-family and multiple-on-lot segments each produced a single closing; no median is meaningful for either, and the figures in those rows are simply the one sale price recorded.
The townhouse segment — four closings — runs from $500,000 to $850,000, with a median PPSF of $568. That rate sits above the single-family median of $543, which is a product of townhouse footprints running small (median 1,304 square feet). With only four sales, this is a range to note rather than a trend to rely on.
Condominiums matched the overall market's PPSF exactly at $543, but at a $784,500 median price — $160,500 below single-family — they represent the segment with the clearest entry point for buyers whose ceiling sits below $1M. Six closings gives that median a reasonable footing without making it robust.
The single-family segment carried the quarter, as it almost always does in Petaluma, with 97 of the 109 closings. Its $945,000 median price sits above the all-segment median of $920,000, reflecting its numerical dominance of the record. The spread — $575,000 to $3,400,000 — is wide enough to contain genuinely different markets within the one label.
List price data is available for this period. Across the 109 closings, the against-asking relationship varied markedly by price band. The $1.5M–$2M band, with a median PPSF of $723 — the highest of any multi-sale band — produced nine closings. The $2M–$3M band's three closings carried a median PPSF of $868. Whether those closings came in above or below their individual asking prices requires the per-transaction list price data, which is present in the source record. The band-level PPSF figures are the closest available proxy in this summary.
By price band
| Price Band | Closings | Median PPSF |
|---|---|---|
| Under $1M | 64 | $533 |
| $1M – $1.5M | 32 | $523 |
| $1.5M – $2M | 9 | $723 |
| $2M – $3M | 3 | $868 |
| $3M – $5M | 1 | $1,294 |
The price-band picture reveals a market that behaves in at least two distinct ways depending on where a property sits. Below $1.5M — 96 of the 109 closings, or 88% of the quarter — the median PPSF ranged from $523 to $533, a narrow band that signals broadly consistent per-foot pricing across the bulk of the market.
Above $1.5M, the PPSF rises steeply with each step. The nine closings in the $1.5M–$2M band posted a $723 median PPSF, 37% above the under-$1M median. The three closings in the $2M–$3M band reached $868. The lone $3M–$5M sale, at Michelle Lane, sits at $1,294. These upper bands are driven by a small number of transactions and individual property characteristics — lot size, condition, location — rather than by broad pricing pressure, but the gradient is consistent and steep.
The $2M–$3M band, with only three closings, has a median but one that carries limited statistical weight. The range for those three sales ran from $2,100,000 (twice) to $2,125,000 — tightly clustered in this case, though that is a coincidence of the mix rather than a signal of band-level pricing discipline.
Also worth noting: no closings recorded in the $3M–$5M band except for the single Michelle Lane transaction, and nothing above $3.4M. The quarter had a ceiling, and it was reached once.
Across the period
| Month | Closings | Median Price | Median PPSF |
|---|---|---|---|
| July 2026 | 36 | $920,000 | $536 |
| August 2026 | 32 | $891,000 | $572 |
| September 2026 | 41 | $1,000,000 | $535 |
July and September closed at nearly identical median PPSF figures ($536 and $535), while August came in $36–$37 higher at $572 — an apparent mid-quarter uptick that coincides with the lowest closing count of the three months. A smaller August pool that happened to include several compact, higher-PPSF properties could produce exactly this pattern without any underlying price movement.
The more striking number is September's $1,000,000 median price against July's $920,000. September recorded 41 closings — the busiest month of the quarter — and its mix leaned toward larger, higher-priced single-family homes. Three of the four $2M-plus closings fell in September. Strip those out and September's median would look considerably closer to July's. The month-by-month movement here is largely a story of mix rather than trajectory.
Of the 70 closings with a DOM figure recorded, 9 closed in under 7 days, 18 in 8–21 days, 28 in 22–60 days, and 15 took longer than 60 days. The longest recorded stretch was 132 days. The median DOM of 26 days sits in the 22–60-day cohort, which was the largest single group. That distribution — roughly equal numbers moving quickly and moving slowly — does not describe a uniformly fast or uniformly sluggish quarter. Properties at opposite ends of the DOM range closed in the same months.
What it means
For sellers: The quarter's 109 closings across $113.7 million in volume show an active market with a functioning upper end. The $1.5M+ segment — 13 closings — produced its highest per-foot rates in the $2M+ band, and the quarter's top sale cleared $3.4M. Below $1M, 64 closings at a $533 median PPSF suggest steady absorption but not the kind of per-foot compression that signals an oversupplied sub-market. The spread in days on market — from zero to 132 — indicates that individual property factors are doing significant work in determining how long a listing takes to close. September closed 41 transactions, the busiest month of the quarter.
For buyers: The sub-$1M band absorbed 64 closings in Q3, more than half the quarter's activity, at a $533 median PPSF. The condominium segment — six closings, median $784,500 — represents the most accessible price point in the recorded data. The $1M–$1.5M band added 32 more closings at a $523 median PPSF, very close to the sub-$1M rate. Above $1.5M, per-foot rates rise sharply and sample sizes shrink; buyers in that range are pricing individual properties more than a band. Fifteen closings in the data set took more than 60 days to settle, indicating that extended timelines do occur and are not limited to a particular price tier.
For owners not transacting: The quarter's $920,000 overall median and $943,000 single-family median sit on a market that moved 109 transactions in 92 days. The $113.7M in total volume spread across those closings averages roughly $1.04M per transaction — pulled above median by the upper-band sales. The quarter produced no evidence of band-level price deterioration: all five price bands recorded closings, and per-foot rates rose consistently with price tier.
Jake Taylor · CA DRE #02070119
[email protected] · (707) 630-1001
More from Petaluma
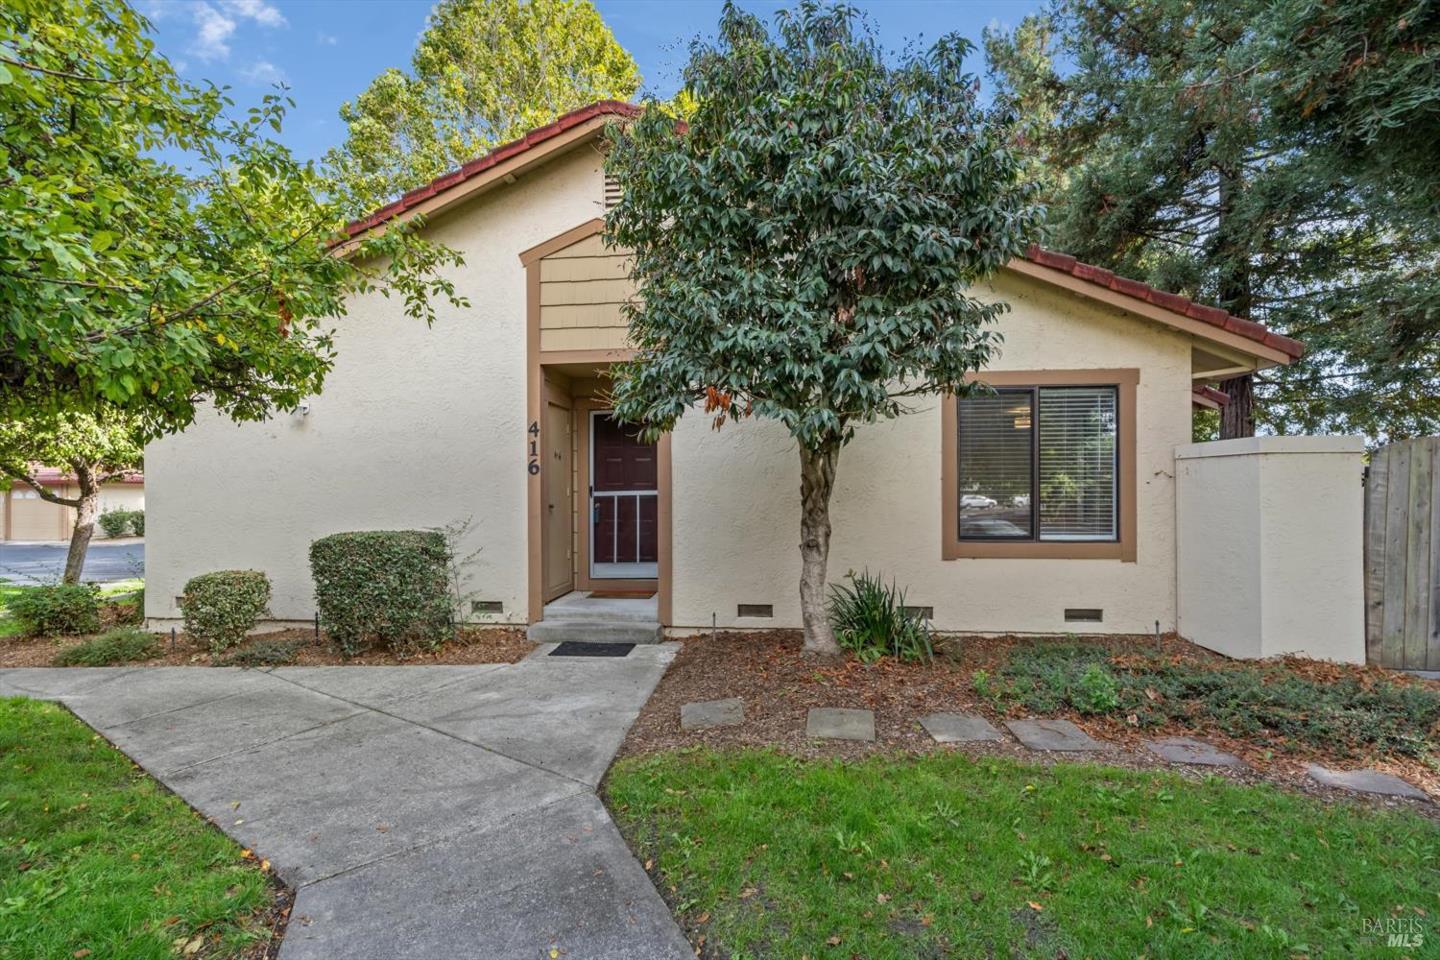
416 Park Place asks $60,000 below what similar Petaluma condos have been selling for
Among the three similar condos and townhomes currently listed in Petaluma, 416 Park Place ranks second-cheapest by price and comes in at $458 per square foot against a peer median ask of $454. The gap to the peer median sold price over the last 12 months is $60,000.
Petaluma's September Median Hits $1,000,000 on 41 Closings, Led by a $3.4M Outlier
Forty-one sales closed in September 2026, ranging from $500,000 to $3,400,000. The overall median landed exactly at $1,000,000, with a single Michelle Lane transaction accounting for more than 7% of the month's total volume.
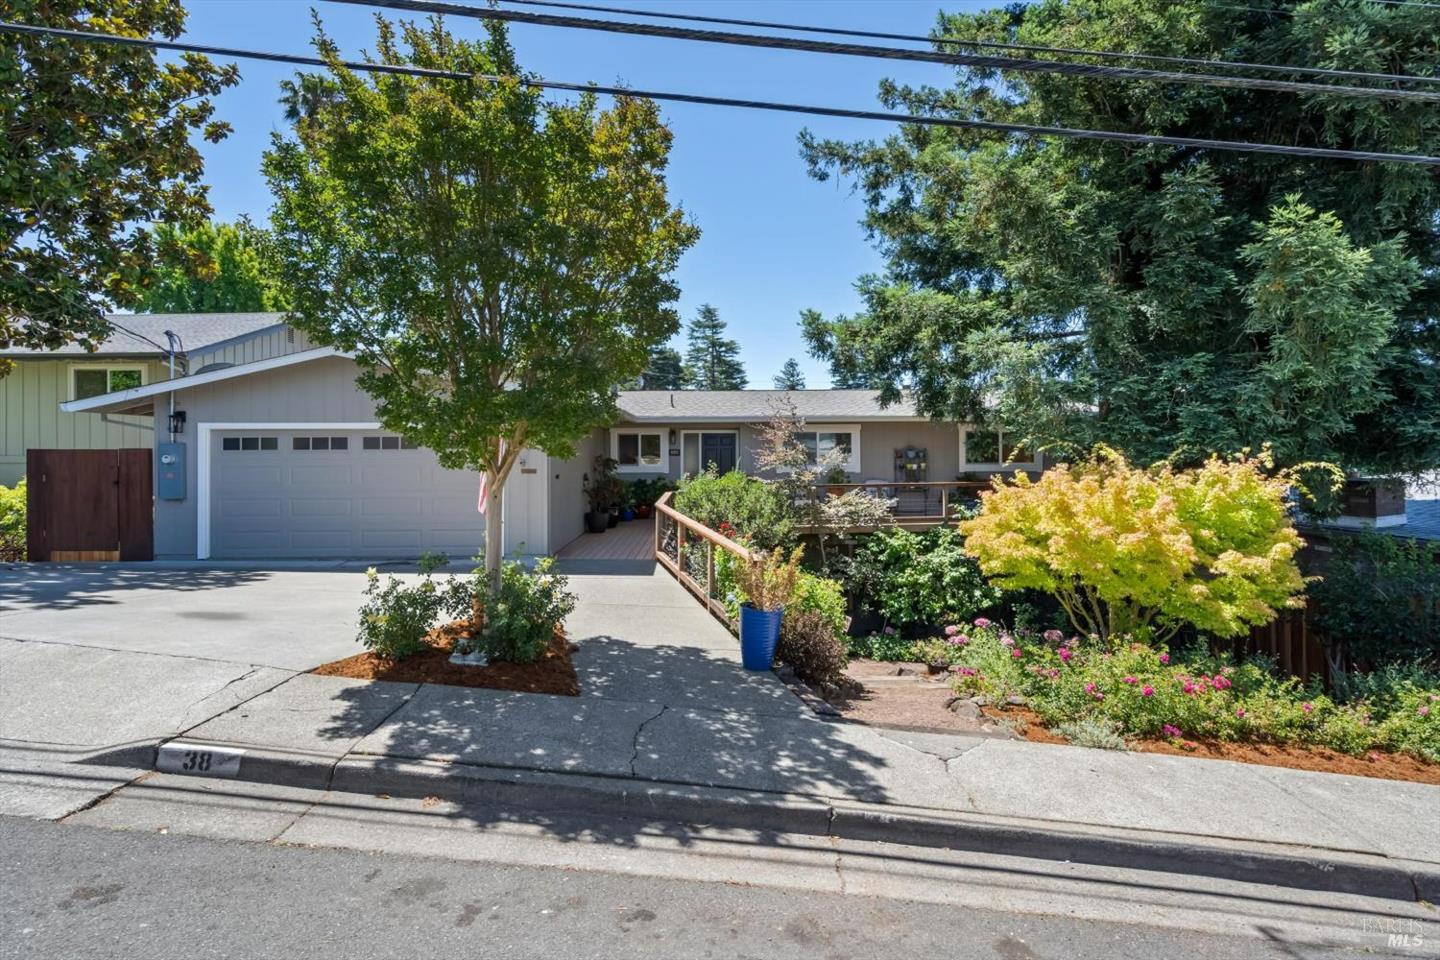
Emma Way paid $51,000 over ask — yet it wasn't September 29's biggest premium
The day's clearest signal came from the recorded closings: two of three single-family homes sold above their list prices, while the third closed $20,000 short. Three more went pending and two new listings hit the MLS.