360 Closings, $395M in Volume: Petaluma's 2026 Market Runs $924K at the Median — With a $6.6M Outlier That Rewrites the Top of the Roster
The period at a glance
The single transaction that most disrupts a tidy narrative of Petaluma 2026 is 555 Magnolia Avenue: a 1,766-square-foot, 1949-built single-family home on a 64,468-square-foot lot that closed in June at $3,304,000 — $1,871 per square foot, the highest unit rate in the entire 360-sale record. Ninety lots away in the price band below it, four-bedroom homes were transacting at $510–$702 per square foot. The lot explains the gap more than the house does, but the closing record offers no further breakdown. That tension — modest square footage, exceptional land, exceptional price — runs through Petaluma's upper tier all year.
List prices are not available in the source for this period. No inferences are drawn about asking prices or pricing discipline.
Days on market are not recorded in this source for any of the 360 closings. No speed analysis appears in this report.
| Metric | Value |
|---|---|
| Period | Jan 1 – Sep 26, 2026 |
| Total closings | 360 |
| Total volume | $395,111,034 |
| Median sale price (all segments) | $924,000 |
| Median price per sq ft | $550 |
| Median square footage | 1,773 |
| Median lot size | 6,203 sq ft |
| Price range | $317,500 – $6,600,000 |
| Segments tracked | 7 |
Across 360 closings, the market-wide median price settled at $924,000 and the market-wide median price per square foot at $550. Those numbers, however, mask a pronounced bifurcation. The 205 closings under $1 million — 57 percent of all transactions — carried a median of $536 per square foot. The 6 closings at $3 million or above carried a median of $1,173 per square foot in the $3M–$5M band alone, with the lone $5M-plus closing at $612 per square foot (a function of the 10,792-square-foot multi-family building at 6614 Lakeville Highway). The market's center of gravity sits firmly below seven figures by transaction count, while the upper tier accounts for a disproportionate share of total dollar volume.
The month-by-month record shows January's median price at $1,050,000 — the highest of any month — sliding to $857,500 in April before recovering into the $920,000–$965,000 range through the summer. Whether composition effects (mix of segments closing each month) drive that pattern or price-level shifts do, the closing record alone cannot determine.
The sales
The table below shows the top 40 closings by price from the full 360-sale period. It is not a complete record.
| Address | Segment | Closed | Sale Price | Sq Ft | Beds | $/Sq Ft | Yr Built |
|---|---|---|---|---|---|---|---|
| 6614 Lakeville Highway | Multi-family | Jun 2 | $6,600,000 | 10,792 | 11 | $612 | — |
| 394 Monte Vista Lane | Single Family | May 29 | $4,000,000 | 4,665 | 5 | $857 | — |
| 1975 Middle Two Rock Rd | Other | Mar 6 | $3,500,000 | 2,216 | 3 | $1,579 | 1957 |
| 1345 San Antonio Road | Single Family | Jun 17 | $3,412,500 | 3,694 | 4 | $924 | — |
| 9 Michelle Ln | Single Family | Sep 14 | $3,400,000 | 2,627 | 4 | $1,294 | 2020 |
| 555 Magnolia Ave | Single Family | Jun 26 | $3,304,000 | 1,766 | 2 | $1,871 | 1949 |
| 2183 Live Oak Farm Lane | Single Family | Mar 27 | $3,146,500 | 2,995 | 4 | $1,051 | — |
| 1024 Cohen Court | Single Family | May 26 | $2,950,000 | 4,865 | 4 | $606 | — |
| 260 Metz Lane | Single Family | Jun 30 | $2,900,000 | 4,129 | 4 | $702 | — |
| 365 Ely Road N | Single Family | Jan 26 | $2,875,000 | 4,289 | 4 | $670 | — |
| 146 Shelina Vista Ln | Single Family | Mar 26 | $2,282,000 | 3,520 | 5 | $648 | 2000 |
| 512 Mcnear Ave | Single Family | May 29 | $2,225,000 | 3,478 | 4 | $640 | 1993 |
| 96 Valley View Drive | Single Family | Apr 16 | $2,205,000 | 3,813 | 4 | $578 | — |
| 23 Pinnacle Dr | Single Family | Feb 19 | $2,136,000 | 3,454 | 4 | $618 | 2003 |
| 3150 Pepper Rd | Single Family | Sep 17 | $2,100,000 | 2,286 | 3 | $919 | 1925 |
| 1100 Gossage Avenue | Single Family | Jul 30 | $2,100,000 | 2,665 | 4 | $788 | — |
| 105 G Street | Single Family | Mar 9 | $2,063,000 | 2,047 | 3 | $1,008 | — |
| 228 Stowring Rd | Single Family | Jun 23 | $2,035,000 | 2,974 | 4 | $684 | — |
| 1946 Matzen Ranch Cir | Single Family | Jun 2 | $2,000,000 | 3,920 | 4 | $510 | 1995 |
| 2850 Western Avenue | Single Family | Jan 22 | $1,992,715 | 2,828 | 4 | $705 | — |
| 7 Lavender Ter | Single Family | Jun 1 | $1,975,000 | 2,618 | 5 | $754 | 2000 |
| 15 Kingswood Dr | Single Family | Feb 3 | $1,950,000 | 3,458 | 4 | $564 | 1994 |
| 450 Amber Way | Single Family | Jun 5 | $1,910,000 | 2,939 | 4 | $650 | 1991 |
| 100 Metz Lane | Single Family | Jan 9 | $1,905,000 | 3,388 | 5 | $562 | — |
| 100 Frances Way | Single Family | May 8 | $1,875,000 | 2,696 | 3 | $695 | — |
| 319 Jester Ct | Single Family | May 21 | $1,850,000 | 3,387 | 5 | $546 | 1992 |
| 819 Sunnyslope Rd | Single Family | Apr 20 | $1,825,000 | 2,918 | 4 | $625 | 1900 |
| 14 Red Barn Court | Single Family | Jun 6 | $1,809,000 | 2,491 | 3 | $726 | — |
| 107 6th St | Single Family | Jul 2 | $1,785,000 | 1,725 | 3 | $1,035 | 1900 |
| 50&52 Red Barn Court | Single Family | Jul 7 | $1,778,975 | 3,364 | 4 | $529 | — |
| 811 D Street | Single Family | Feb 27 | $1,775,000 | 3,672 | 4 | $483 | — |
| 101 Mcbrown Rd | Single Family | Apr 13 | $1,750,000 | 2,320 | 4 | $754 | 1971 |
| 2212 Magnolia Avenue | Single Family | Aug 31 | $1,750,000 | 2,420 | 3 | $723 | — |
| 15 Brainerd Avenue | Single Family | Jul 16 | $1,750,000 | 1,976 | 3 | $886 | — |
| 17 10th St | Single Family | Jun 22 | $1,725,000 | 2,136 | 4 | $808 | 1885 |
| 1811 Maiden Ln | Single Family | Mar 30 | $1,710,000 | 3,416 | 5 | $501 | 1991 |
| 614 E St | Single Family | Sep 15 | $1,705,000 | 1,281 | 3 | $1,331 | 1880 |
| 614 Deer Valley Ct | Single Family | Sep 24 | $1,703,405 | 2,811 | 5 | $606 | 1950 |
| 1829 Castle Dr | Single Family | Jun 19 | $1,700,000 | 3,094 | 4 | $549 | 1992 |
| 3957 Lakeville Hwy | Other | Mar 20 | $1,700,000 | 1,878 | 4 | $905 | 1925 |
Four closings warrant closer reading.
6614 Lakeville Highway is the year's largest transaction at $6,600,000 — an 11-bedroom, 10,792-square-foot multi-family property that cleared at $612 per square foot. By unit rate, it is the cheapest property in the top 40. Size absorbed what price could not.
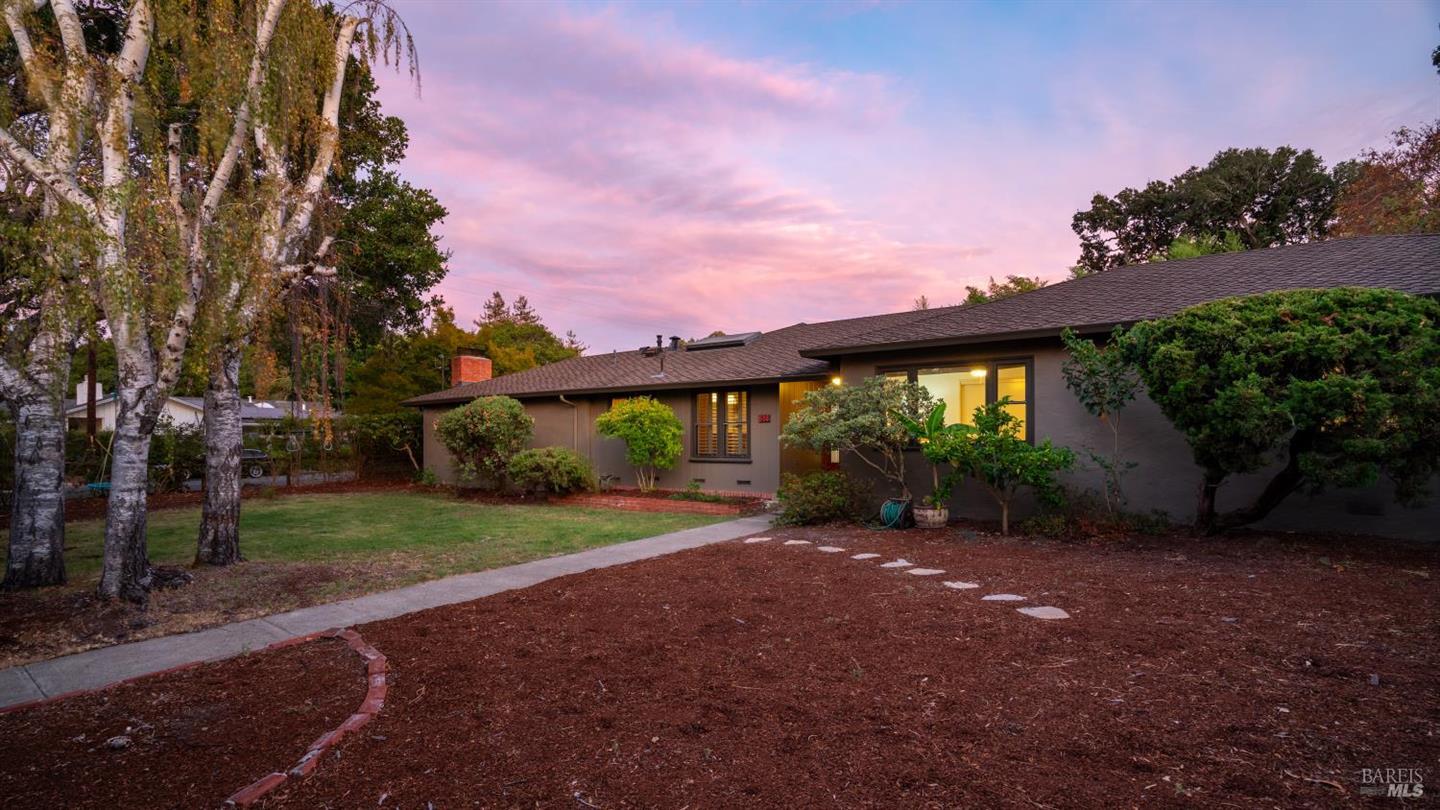
555 Magnolia Avenue inverted that arithmetic entirely. The 1949-built, 1,766-square-foot home on a 64,468-square-foot lot closed at $3,304,000 — $1,871 per square foot, the highest unit rate of any closing in the 360-sale record. The lot is roughly 1.5 acres inside Petaluma city limits; the structure is incidental to that math.
1975 Middle Two Rock Road, classified as Other, closed at $3,500,000 on 8.2 acres (358,498 square feet). At $1,579 per square foot of building, it is the second-highest unit rate in the roster. Both it and Magnolia Avenue suggest the upper-tier premium is being priced off land, not livable square footage.
614 E Street — a three-bedroom, 1,281-square-foot home built in 1880, on a 7,501-square-foot downtown lot — closed in September at $1,705,000 ($1,331 per square foot), making it the highest unit rate among non-acreage single-family homes of under 1,500 square feet. Downtown vintage-stock continues to carry a premium in this record regardless of size.
Where the market split
By segment
| Segment | Closings | Median Price | Median $/Sq Ft | Median Sq Ft | Price Range |
|---|---|---|---|---|---|
| Single Family | 283 | $987,000 | $561 | 1,882 | $419K – $4.0M |
| Other | 40 | $800,000 | $529 | 1,396 | $405K – $3.5M |
| Condominium | 21 | $670,000 | $442 | 1,516 | $317.5K – $975K |
| Townhouse | 9 | $715,000 | $441 | 1,430 | $619K – $850K |
| Multi-family | 5 | $960,000 | $707 | 1,556 | $750K – $6.6M |
| Multiple on Lot | 1 | — | $399 | 2,632 | $1,050,000 |
| Mobile Home | 1 | — | $1,051 | 1,188 | $1,249,000 |
Multiple on Lot and Mobile Home each recorded one sale; no median is calculable. The range is the single data point.
Single family dominates by count — 283 of 360 closings, or 79 percent — with a median of $987,000 and $561 per square foot across a median of 1,882 square feet. The Other segment (40 closings, which includes rural and mixed-use parcels) ran at a lower median price ($800,000) but with a wide enough range ($405,000–$3,500,000) that its median carries moderate descriptive weight.
Condominiums and townhouses occupied the most compressed band. Condos (21 sales, $317,500–$975,000, median $670,000 at $442/sq ft) and townhouses (9 sales, $619,000–$850,000, median $715,000 at $441/sq ft) were virtually identical on a per-square-foot basis, though the townhouse floor was higher by $301,500. With 9 townhouse closings, the segment median is reported but should be read with the understanding that the sample is thin.
Multi-family is the most distorted segment in the record. Five closings spanning $750,000 to $6,600,000 produce a median of $960,000 — a figure that sits between the second and fifth sale and is shaped heavily by the gap between the 6614 Lakeville Highway outlier and the remaining four transactions.
By price band
| Price Band | Closings | Median $/Sq Ft | Share of Transactions |
|---|---|---|---|
| Under $1M | 205 | $536 | 56.9% |
| $1M – $1.5M | 103 | $532 | 28.6% |
| $1.5M – $2M | 33 | $673 | 9.2% |
| $2M – $3M | 12 | $659 | 3.3% |
| $3M – $5M | 6 | $1,173 | 1.7% |
| $5M and up | 1 | $612 | 0.3% |
The price-band data contains the year's most telling discontinuity. From under $1M through $2M–$3M, the median price per square foot moves in a narrow corridor: $532–$673. At $3M–$5M, it jumps to $1,173 — nearly double the band immediately below. Six closings sit in that range; both the land-intensive Magnolia Avenue and the Middle Two Rock Road acreage parcel contribute to that spike. The lone closing above $5M (6614 Lakeville Highway at $612/sq ft) is below every band above $1M on a unit-rate basis, demonstrating how building size alone can suppress the metric.
A full 85.5 percent of transactions closed below $1.5 million. The sub-$1M band alone accounts for more than half of all closings.
Across the period
| Month | Closings | Median Price | Median $/Sq Ft |
|---|---|---|---|
| Jan 2026 | 27 | $1,050,000 | $545 |
| Feb 2026 | 27 | $955,000 | $528 |
| Mar 2026 | 37 | $1,005,000 | $558 |
| Apr 2026 | 46 | $857,500 | $557 |
| May 2026 | 49 | $920,000 | $550 |
| Jun 2026 | 63 | $965,000 | $546 |
| Jul 2026 | 52 | $924,000 | $558 |
| Aug 2026 | 32 | $891,000 | $589 |
| Sep 2026 | 27 | $925,000 | $548 |
September count covers closings through September 26 only and is likely incomplete for the full month.
The volume arc follows a recognizable pattern. January and February each recorded 27 closings; by April that had risen to 46 and by May to 49. June was the busiest month of the year at 63 closings, followed by a pullback to 52 in July, 32 in August, and 27 in September (partial). Total volume through the nine-month window: $395.1 million across 360 transactions.
Median price by month is harder to interpret cleanly, because segment composition shifts month to month. January's median of $1,050,000 was the highest recorded — driven in part by the presence of several high-end single-family closings that month (365 Ely Road N at $2,875,000, 2850 Western Avenue at $1,992,715, 100 Metz Lane at $1,905,000). April's median of $857,500 was the lowest of the year despite 46 closings — a volume month with a lower-priced composition. June's 63 closings produced a median of $965,000, anchored by a mix that included both the $6,600,000 Lakeville Highway multi-family and several sub-$1M transactions.
Median price per square foot held within a 61-point range across all nine months ($528 in February to $589 in August), which is a narrower band than the median-price swings suggest. August stands out: 32 closings, the lowest non-January/February/September count, yet the highest median price per square foot at $589. The composition of those 32 sales — weighted toward smaller, higher-unit-rate properties — accounts for the divergence between that month's median price ($891,000) and its median rate per square foot.
What it means
For sellers
The nine-month record through September 26 shows 360 transactions completing at a market-wide median of $924,000. The sub-$1.5M range — 308 of 360 closings — absorbed the bulk of activity at a relatively stable per-square-foot rate between $532 and $673. Above $3 million, the six recorded closings suggest a thin but active tier where land characteristics appear to drive the unit rate to levels ($1,173 median per square foot) well above any lower band. Properties in the $3M-plus tier with acreage have closed; those without exceptional land or scale have generally transacted at lower per-square-foot figures.
For buyers
The data shows that 205 of 360 Petaluma closings — more than half — occurred below $1 million, with a median price per square foot of $536 on a median of roughly 1,882 square feet (using the single-family segment as the dominant proxy). The condominium and townhouse segments recorded 30 combined closings, ranging from $317,500 to $975,000, giving the market an active lower tier. The $1.5M–$2M band (33 closings) and the $2M–$3M band (12 closings) both cleared at lower unit rates ($673 and $659 per square foot respectively) than the $3M–$5M band ($1,173), a pattern consistent with land-intensive properties clustering at the upper end.
For owners not transacting
Across nine months and 360 recorded closings, Petaluma's market-wide median price per square foot held between $528 and $589, a range of 11 percent. The median sale price oscillated more widely — $857,500 to $1,050,000 — but that variance tracks composition shifts (which segments and price bands contributed closings in a given month) as much as it does price-level changes. Total recorded volume of $395.1 million across a nine-month period places the market's annualized pace above $525 million if the current trajectory holds — though the closing record describes what happened, not what follows.
Jake Taylor · CA DRE #02070119
[email protected] · (707) 630-1001
More from Petaluma
What Your Petaluma Home Is Missing Depends on When It Was Built
More than half of Petaluma's parcels were built before 1980, when insulation requirements were thin and single-pane glass was standard. Knowing your era tells you where to start.
Clean Your Gutters Before Petaluma's First Rain Does the Job for You
More than half of Petaluma's housing stock was built before 1980. That means a lot of gutters that have been bending, settling, and collecting debris for decades. September is the window to sort them out.
Two homes hit the Petaluma MLS on September 25 — and that was the day
A single-family home on Burlington Drive and a townhouse on Drake Court appeared on the MLS feed on September 25. No sales recorded, no contracts signed.