Petaluma's September Median Hits $1,000,000 on 41 Closings, Led by a $3.4M Outlier
The period at a glance
| Metric | September 2026 |
|---|---|
| Total closings | 41 |
| Total volume | $46,492,060 |
| Median sale price | $1,000,000 |
| Mean sale price | $1,133,953 |
| Median price per sq ft | $535 |
| Price range | $500,000 – $3,400,000 |
| Median lot size | 6,295 sq ft |
| Median finished size | 1,776 sq ft |
| List prices available | Partial (10 of 41) |
| Days on market | Partial (12 of 41 reported) |
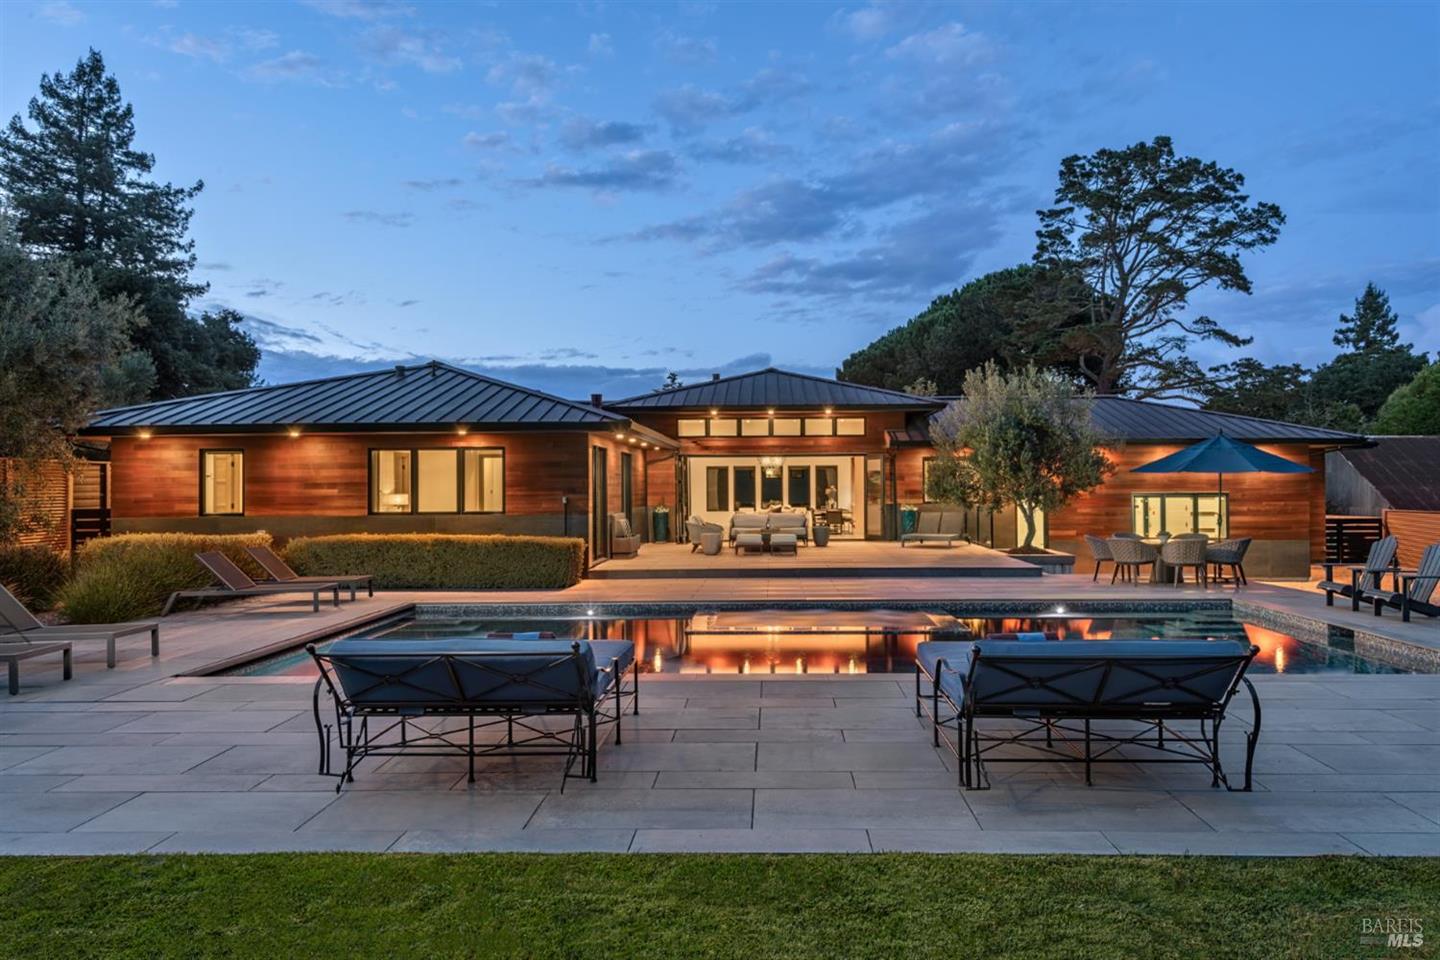
September produced 41 closings and $46.5 million in total volume — the busiest month in the three-month window the data covers. The median of $1,000,000 sits $80,000 above July's $920,000 and $109,000 above August's $891,000, though that gap is partly a function of what happened to close in a given month rather than a clean directional signal. The mean of $1,133,953 runs $133,953 above the median, a spread that points toward the upper end of the roster pulling the average up — specifically, 9 Michelle Lane closing at $3,400,000, a figure no other September sale came within $1.275 million of.
List prices were recorded for only 10 of the 41 transactions, so observations about pricing discipline are limited to that subset. Days on market were reported for 12 of 41 closings — fewer than one in three — so no speed section is warranted here, and the DOM figures cited elsewhere in the roster are noted only for the individual transactions where they appear.
The sales
The table below shows all 41 closings for the month, sorted by sale price.
| Address | Segment | Beds | Baths | Sq Ft | Year Built | Sale Price | $/Sq Ft | % of List | DOM |
|---|---|---|---|---|---|---|---|---|---|
| 9 Michelle Lane | Single Family | 4 | 3 | 2,627 | 2020 | $3,400,000 | $1,294 | — | — |
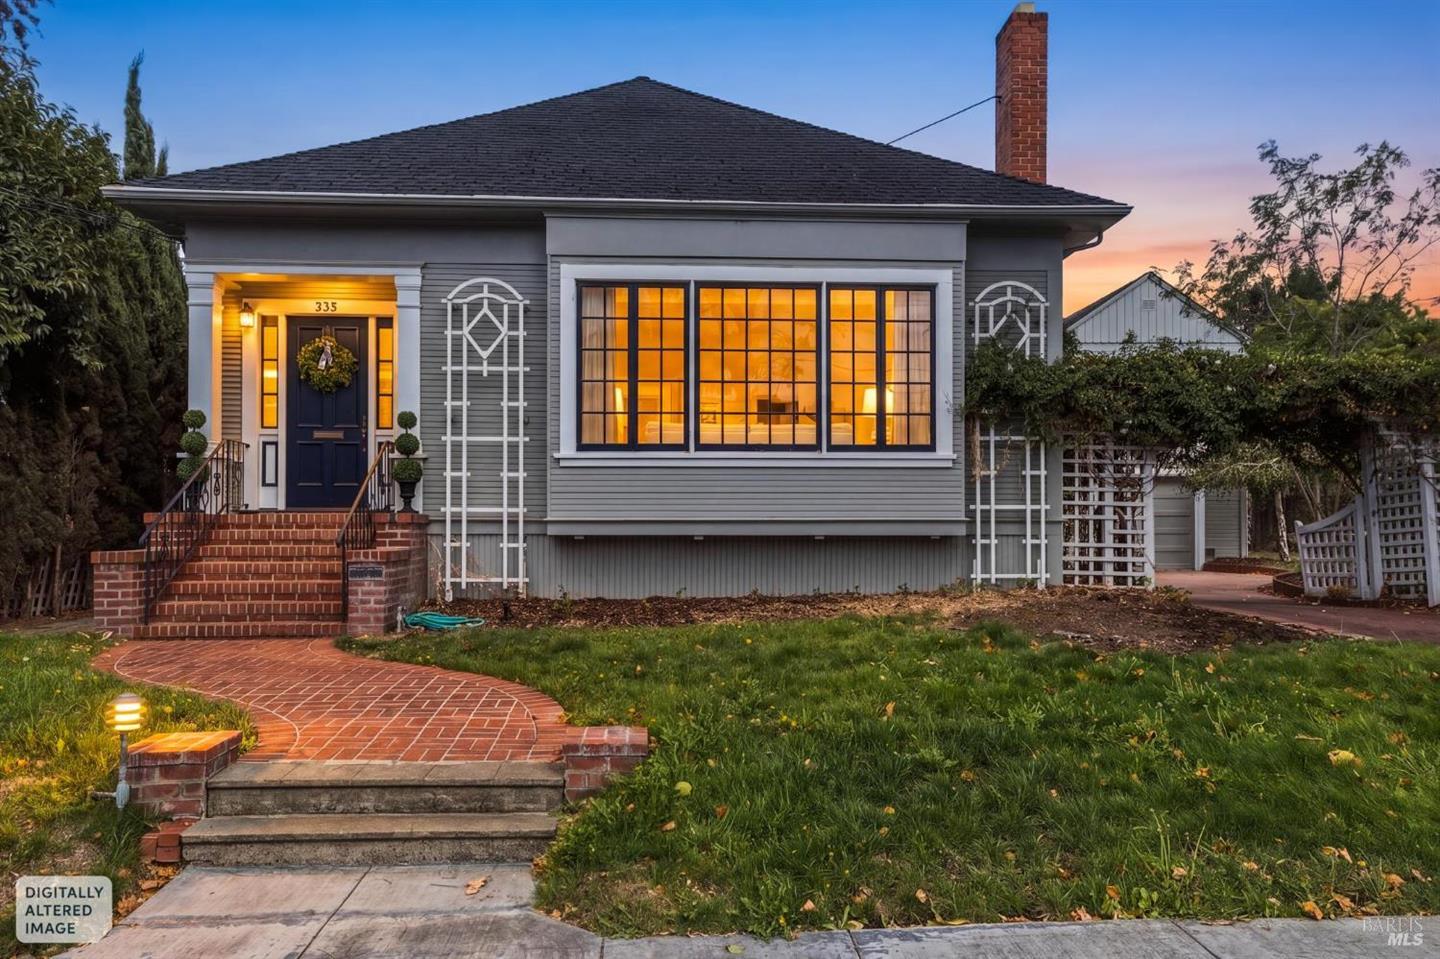
| 335 Bassett Street | Single Family | 3 | 2 | 2,449 | 1906 | $2,125,000 | $868 | 96.6% | — |
| 3150 Pepper Road | Single Family | 3 | 3 | 2,286 | 1925 | $2,100,000 | $919 | — | — |
| 39 Barn View Ct | Single Family | 3 | 3 | 2,491 | 2026 | $1,832,655 | $736 | — | — |
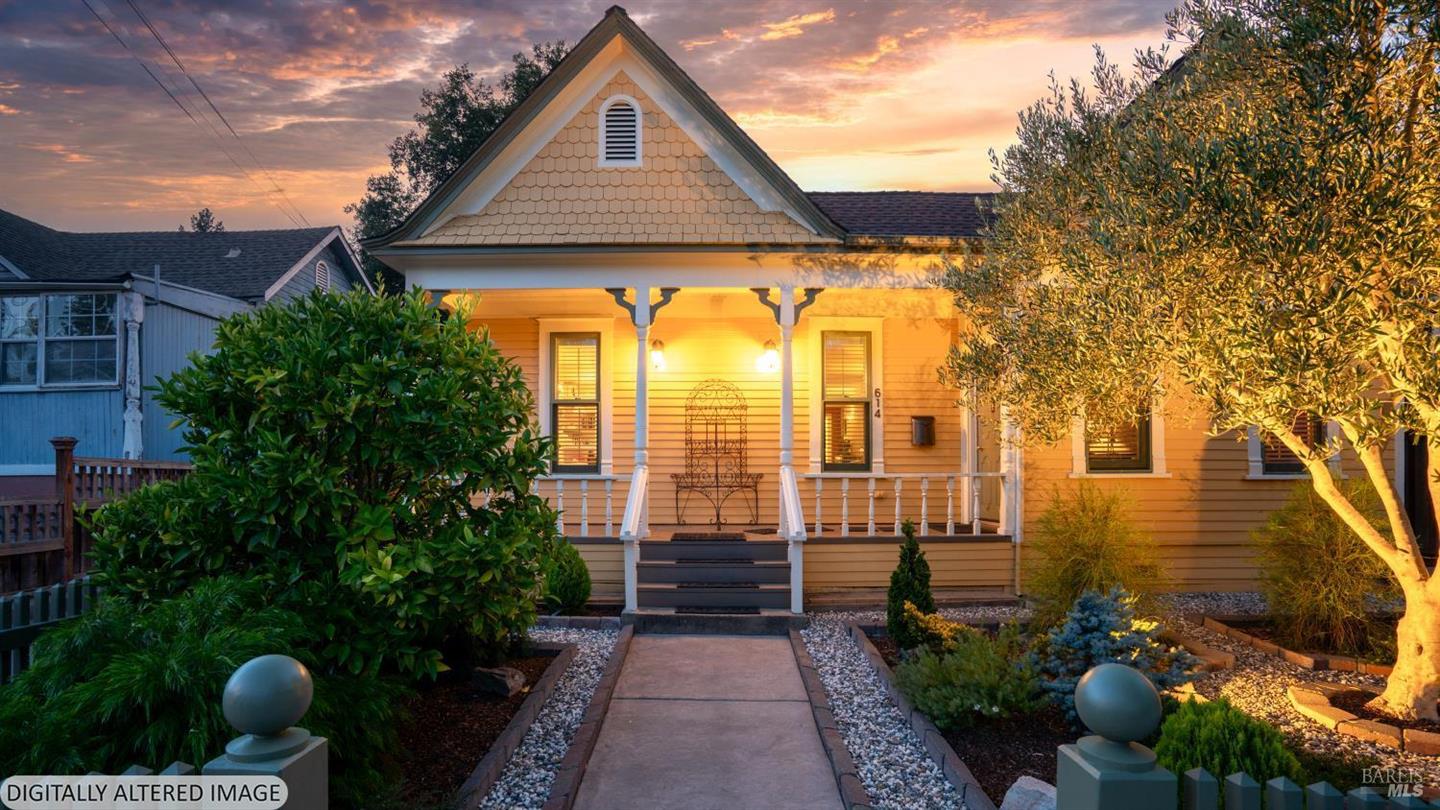
| 614 E Street | Single Family | 3 | 2 | 1,281 | 1880 | $1,705,000 | $1,331 | — | — |
| 614 Deer Valley Court | Single Family | 5 | 4 | 2,811 | 1950 | $1,703,405 | $606 | 126.2% | — |
| 73 Aloha Court | Single Family | 5 | 3 | 3,196 | 1980 | $1,675,000 | $524 | — | — |
| 121 Belle View Avenue | Single Family | 4 | 2 | 1,557 | 1928 | $1,455,000 | $934 | — | — |
| 705 5th Street | Single Family | 3 | 2 | 1,369 | 1940 | $1,400,000 | $1,023 | 100.0% | — |
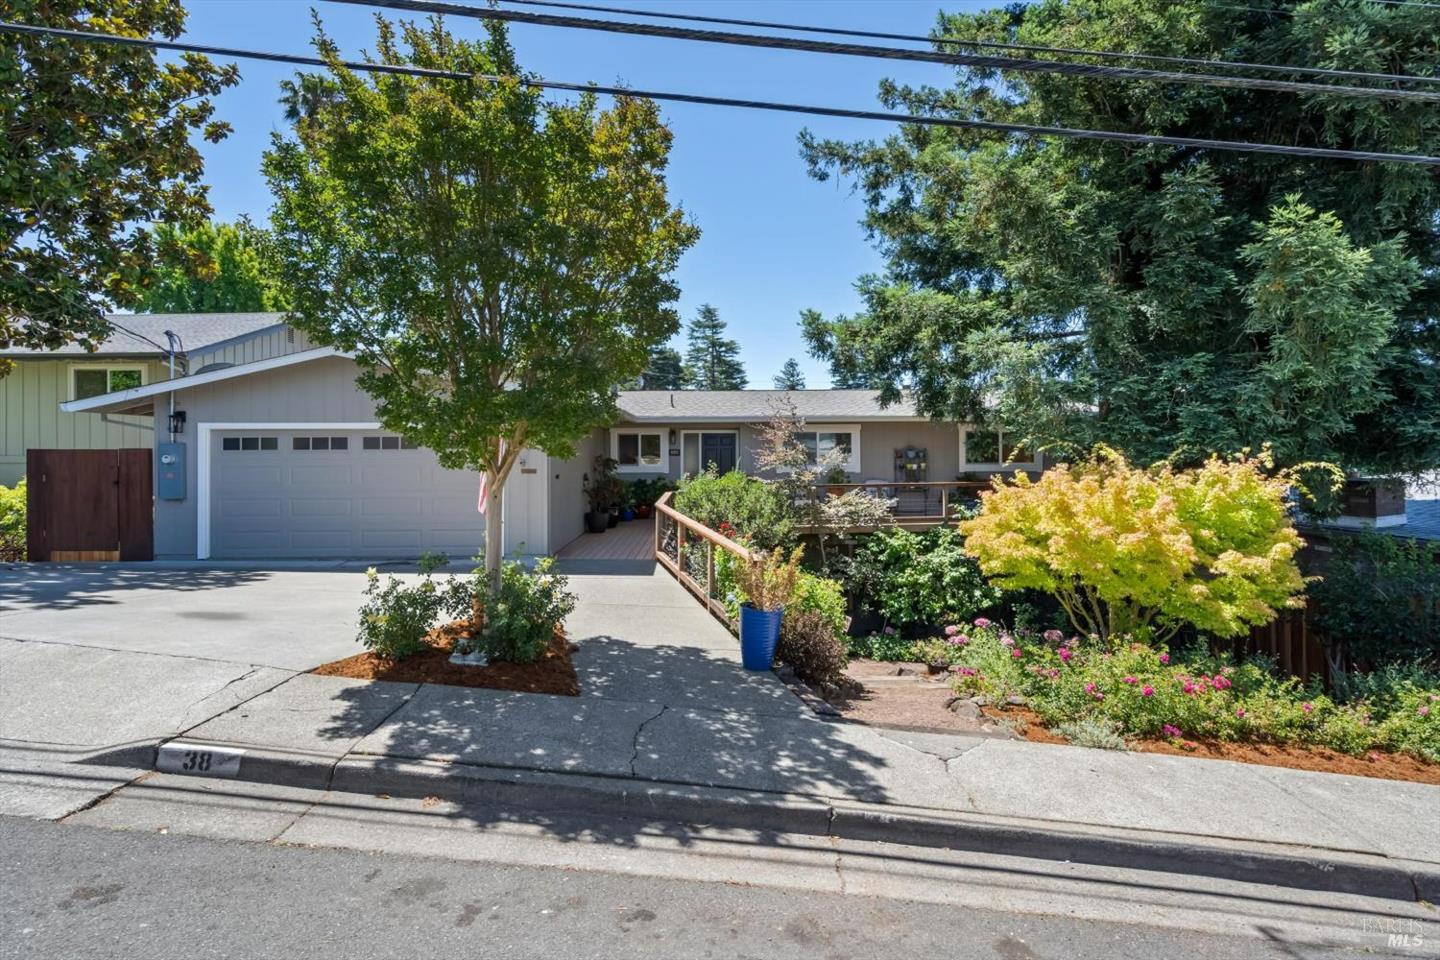
| 38 Mission Drive | Single Family | 4 | 3 | 2,614 | 1965 | $1,325,000 | $507 | 102.0% | — |
| 1661 Andover Way | Single Family | 5 | 4 | 2,538 | 1995 | $1,250,000 | $493 | — | — |
| 547 Sapphire Street | Single Family | 5 | 3 | 2,650 | 2023 | $1,225,000 | $462 | — | — |
| 956 Phillips Avenue | Single Family | 2 | 2 | 1,658 | 1953 | $1,200,000 | $724 | — | — |
| 3 Vintage Court | Single Family | 4 | 3 | 2,330 | 1997 | $1,115,000 | $479 | — | — |
| 1804 Adobe Creek Drive | Single Family | 5 | 3 | 3,006 | 1992 | $1,115,000 | $371 | 98.8% | — |
| 12 Nob Hill Terrace | Single Family | 3 | 2 | 1,339 | 1945 | $1,060,000 | $792 | — | — |
| 25 Linda Vista Terrace | Multiple on Lot | 4 | 3 | 2,632 | 1932 | $1,050,000 | $399 | — | — |
| 1759 Emma Way | Single Family | 4 | 3 | 2,333 | 2006 | $1,050,000 | $450 | 105.1% | — |
| 1036 McNear Avenue | Single Family | 3 | 2 | 1,516 | 1973 | $1,016,000 | $670 | — | — |
| 721 Elm Drive | Single Family | 3 | 2 | 1,578 | 1965 | $1,000,000 | $634 | 100.0% | — |
| 20 Eucalyptus Avenue | Single Family | 3 | 1 | 1,300 | — | $1,000,000 | $769 | 87.0% | — |
| 1918 Sestri Lane | Single Family | 4 | 3 | 2,140 | 2000 | $965,000 | $451 | 96.6% | — |
| 1713 Alhambra Court | Single Family | 5 | 3 | 2,115 | 1966 | $950,000 | $449 | 97.9% | — |
| 103 G Street | Condominium | 2 | 3 | 2,091 | 2009 | $925,000 | $442 | — | — |
| 1740 Spyglass Road | Single Family | 3 | 3 | 1,958 | 1993 | $915,000 | $467 | — | — |
| 116 Glacier Court | Single Family | 4 | 2.5 | 2,154 | — | $875,000 | $406 | — | 23 |
| 602 Deerfield Lane | Single Family | 3 | 2 | 2,281 | — | $810,000 | $355 | — | 28 |
| 486 1st Street | Condominium | 2 | 2.5 | 1,479 | — | $810,000 | $548 | — | 69 |
| 1036 Garfield Drive | Single Family | 3 | 2 | 1,694 | 1982 | $800,000 | $472 | — | — |
| 1263 Marian Way | Single Family | 3 | 2 | 1,200 | — | $800,000 | $667 | — | 28 |
| 1521 Sarkesian Drive | Single Family | 4 | 2 | 1,338 | — | $799,000 | $597 | — | 52 |
| 331 Keller Street #3 | Townhouse | 2 | 2.5 | 1,240 | — | $799,000 | $644 | — | 14 |
| 27 Rio Vista Way | Single Family | 3 | 1 | 951 | — | $780,000 | $820 | — | 5 |
| 1304 San Jose Way | Single Family | 4 | 2 | 1,776 | — | $775,000 | $436 | — | 63 |
| 640 Jade Street | Condominium | 3 | 2.5 | 1,989 | — | $759,000 | $382 | — | 80 |
| 18 Eastside Circle | Single Family | 3 | 2 | 1,127 | — | $758,000 | $673 | — | 27 |
| 401 Lindberg Circle | Single Family | 3 | 3 | 1,460 | 2008 | $725,000 | $497 | — | — |
| 1121 Brighton View Circle | Single Family | 3 | 3 | 1,232 | 1998 | $695,000 | $564 | — | — |
| 1409 Morning Glory Drive | Single Family | 3 | 2 | 1,276 | — | $675,000 | $529 | — | 46 |
| 304 S McDowell Boulevard | Single Family | 3 | 1 | 1,074 | — | $575,000 | $535 | — | 38 |
| 2 Rain Tree Court | Townhouse | 2 | 1 | 972 | 1991 | $500,000 | $514 | — | — |
Four transactions that shape the month:
9 Michelle Lane — $3,400,000. A 2020-built, 2,627-square-foot single-family home on a 18,870-square-foot lot, closing at $1,294 per square foot — by far the highest per-square-foot figure in the month and $700,000 above the next closest sale. No list price was recorded, so the relationship to asking is unknown. It contributes roughly $3.4 million of the $46.5 million in total volume and has an outsized effect on the mean. Remove it and the mean falls to approximately $1,090,000.
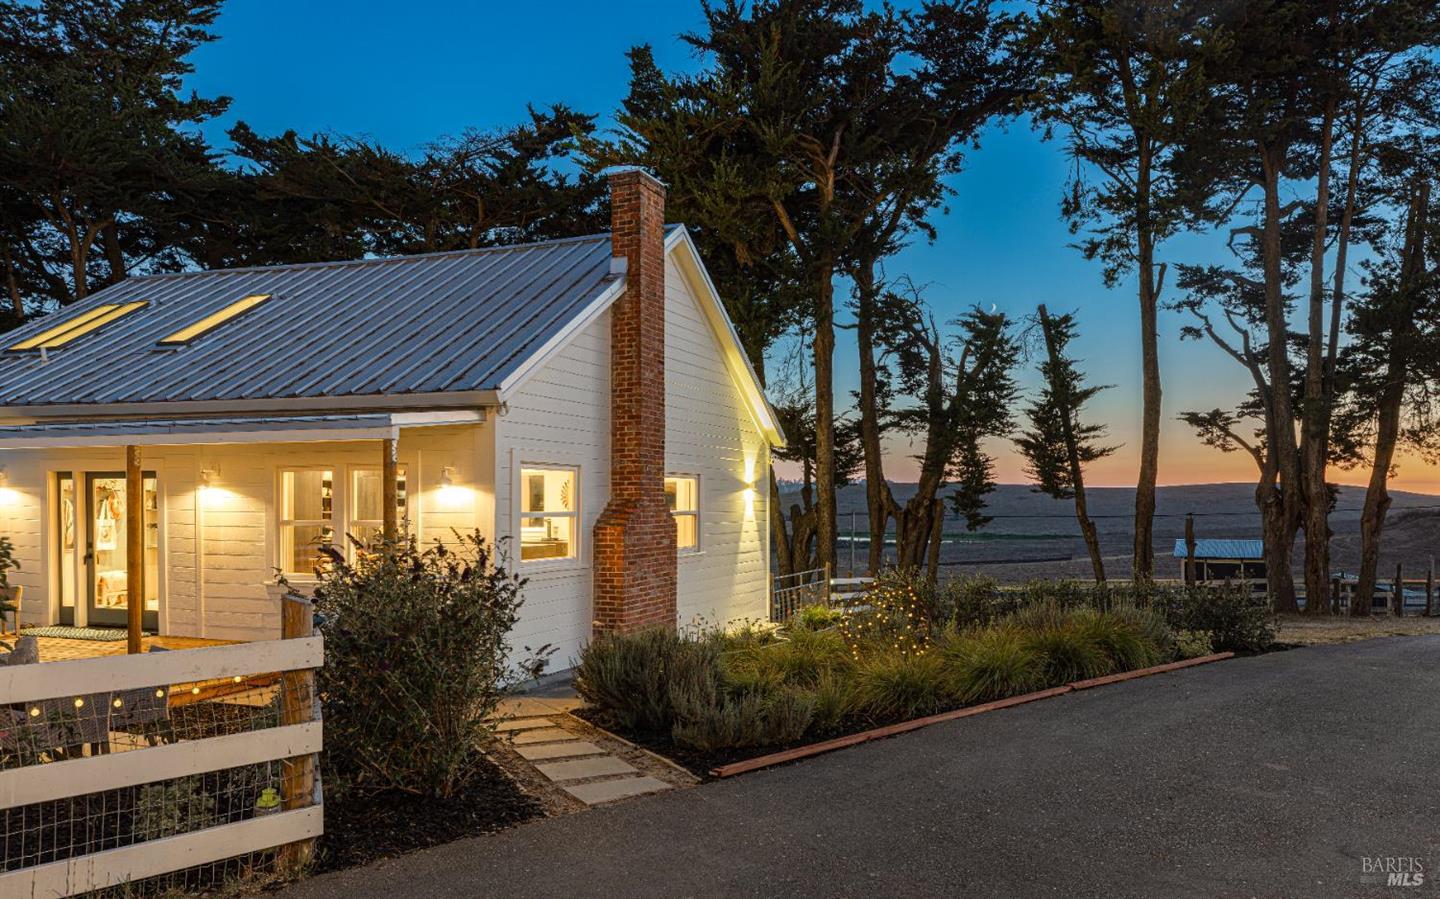
614 Deer Valley Court — $1,703,405 at 126.2% of list. Listed at $1,350,000, this 1950-built, 2,811-square-foot five-bedroom closed at $353,405 over asking — the largest premium in the month among the 10 transactions where list price was recorded. It is the only sale in the data that cleared its list price by more than $300,000 in dollar terms.
3150 Pepper Road — $2,100,000 on a 639,461-square-foot lot. The lot figure — roughly 14.7 acres — distinguishes this 1925-built, three-bedroom property from everything else in the month. No list price was recorded. At $919 per square foot of finished space, it sits at the upper end of the $/sq ft distribution despite the building being a century old.
640 Jade Street — $759,000 after 80 days on market. The longest recorded marketing period of any closing in September, this 1,989-square-foot condominium also carries the lowest per-square-foot price in its segment at $382. Among the 12 closings with DOM recorded, three took longer than 60 days; this was the furthest out.
Where the market split
By segment
| Segment | Closings | Median Price | Median $/Sq Ft | Median Sq Ft | Price Range |
|---|---|---|---|---|---|
| Single Family | 35 | $1,016,000 | $564 | 1,776 | $575,000 – $3,400,000 |
| Condominium | 3 | $810,000 | $442 | 1,989 | $759,000 – $925,000 |
| Townhouse | 2 | — | — | 1,106 | $500,000 – $799,000 |
| Multiple on Lot | 1 | — | — | 2,632 | $1,050,000 |
Single-family homes accounted for 35 of 41 closings, so the overall market figures and the single-family figures are nearly interchangeable. The segment's median of $1,016,000 on 35 sales carries a meaningful sample behind it. The condominium segment produced three closings — just enough to state a median of $810,000 — at a median $442 per square foot, which is $122 per square foot below the single-family figure. The two townhouse closings ($500,000 and $799,000) are too few to support a median; their range spans $299,000. The single Multiple on Lot entry at 25 Linda Vista Terrace closed at $1,050,000 on 2,632 square feet of space built in 1932 — one sale, so no median is presented.
By price band
| Band | Closings | Median Price | Median $/Sq Ft |
|---|---|---|---|
| Under $1M | 20 | $799,000 | $505 |
| $1M – $1.5M | 14 | $1,115,000 | $570 |
| $1.5M – $2M | 4 | $1,704,203 | $671 |
| $2M – $3M | 2 | $2,112,500 | $893 |
| $3M – $5M | 1 | $3,400,000 | $1,294 |
The month split almost evenly between sub-$1M (20 closings) and $1M-and-above (21 closings). The sub-$1M band's median of $799,000 on 20 sales is the most statistically stable figure in the table. Moving up the price ladder, per-square-foot values rise consistently: $505 below $1M, $570 in the $1M–$1.5M band, $671 in the $1.5M–$2M band, and $893 across the two closings in the $2M–$3M band. The $3M–$5M band contains only 9 Michelle Lane; at $1,294 per square foot it is a single data point, not a trend.
The $1.5M–$2M band is worth a closer look. Four closings landed there: 39 Barn View Ct ($1,832,655, new construction from 2026), 614 E Street ($1,705,000, 1880 vintage at $1,331/sq ft), 614 Deer Valley Court ($1,703,405, the month's largest over-list premium), and 73 Aloha Court ($1,675,000, 3,196 square feet on a 1.99-acre lot). Four different vintages, four different situations — the band's median of $1,704,203 reflects the cluster, not uniformity.
Across the period
| Month | Closings | Median Price | Median $/Sq Ft |
|---|---|---|---|
| July 2026 | 36 | $920,000 | $536 |
| August 2026 | 32 | $891,000 | $572 |
| September 2026 | 41 | $1,000,000 | $535 |
Three months of data is a short runway, and this three-month window shows some internal tension worth noting. The median price moved from $920,000 in July to $891,000 in August — a $29,000 step down — then back to $1,000,000 in September, a $109,000 step up. The median per-square-foot figure, however, ran the opposite direction on price: it was $536 in July, rose to $572 in August (the highest of the three months), then eased back to $535 in September. A higher median price alongside a lower median $/sq ft in September compared to August indicates that the mix shifted toward larger or higher-priced properties rather than that individual square feet became more expensive. Closings volume also increased month over month, from 32 in August to 41 in September — the highest of the three months shown.
What it means
For sellers: Thirty-five of 41 September closings were single-family homes. Among the 10 transactions where list prices were recorded, the median closed at 99.4% of list. Five of those 10 closed above asking and five at or below — the outcomes were split. The largest over-list result (126.2% at Deer Valley Court) and the largest discount (87.0% at Eucalyptus Avenue) both appear in that same 10-transaction sample, so the range of outcomes was wide. Inventory currently stands at 62 active listings with a median active price of $885,000 — below September's $1,000,000 median closed price — alongside 13 pending sales.
For buyers: Twenty of 41 September closings came in below $1,000,000, so more than half the month's activity was accessible at sub-seven-figure prices. The condominium segment's three closings ranged from $759,000 to $925,000, with median finished size of 1,989 square feet — larger than the median single-family close for the month. Among the 12 closings with days-on-market data, three took longer than 60 days and one closed in five days; the recorded median was 33 days, though that figure rests on fewer than one-third of the month's closings.
For owners not transacting: September's $46.5 million in total volume across 41 closings represents the strongest month in the three-month window by both measures. The median price has now returned to the $1,000,000 level after two months below it. Whether that reading holds, softens, or extends is not something the September record can answer.
Jake Taylor · CA DRE #02070119
[email protected] · (707) 630-1001
More from Petaluma
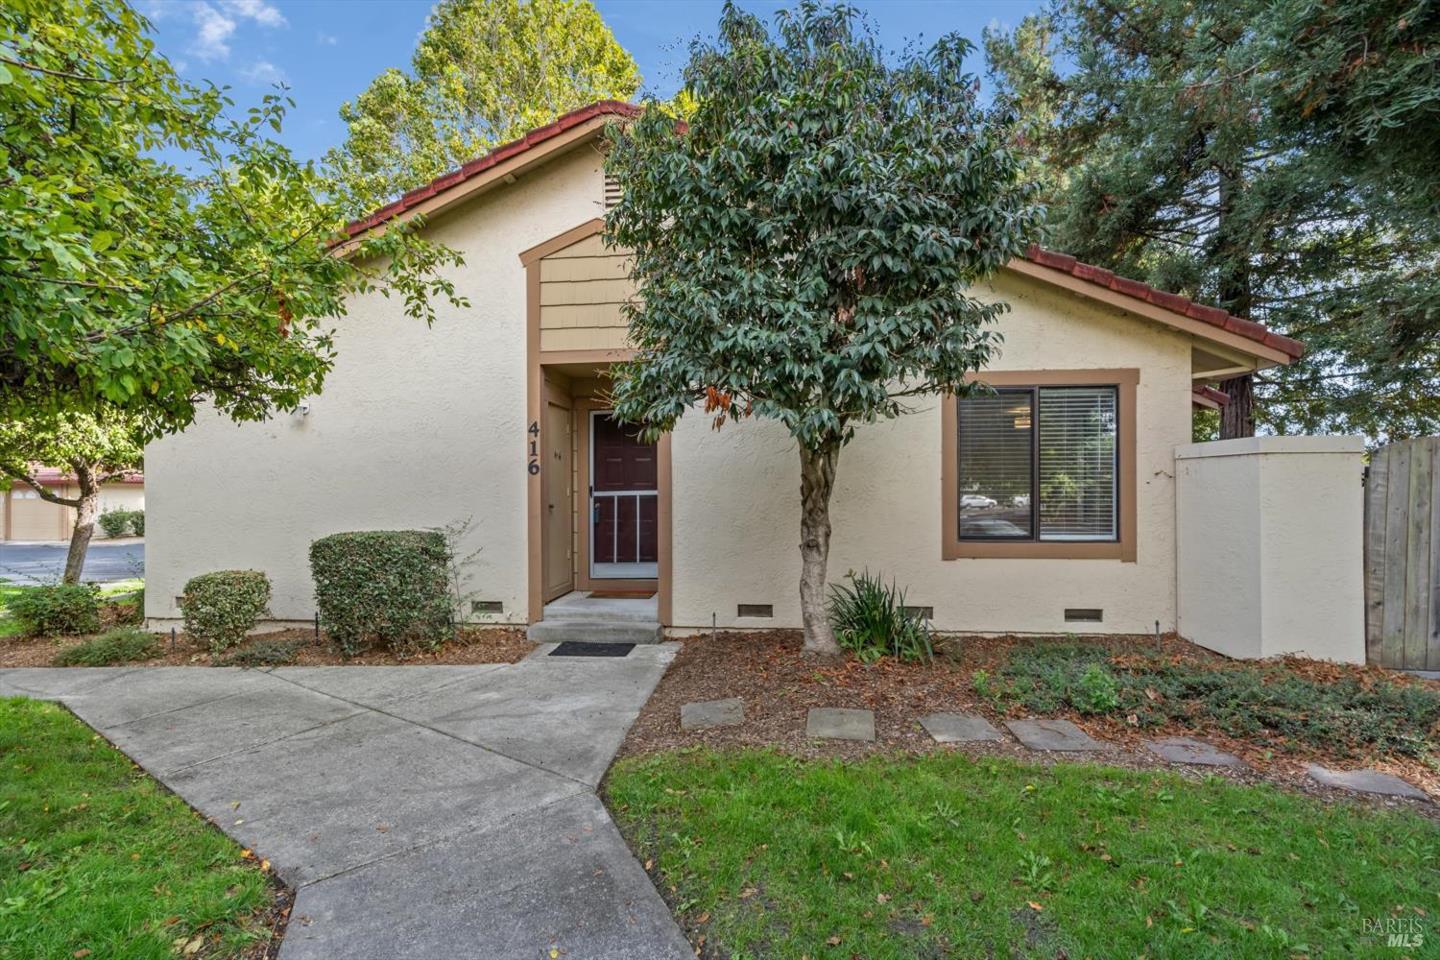
416 Park Place asks $60,000 below what similar Petaluma condos have been selling for
Among the three similar condos and townhomes currently listed in Petaluma, 416 Park Place ranks second-cheapest by price and comes in at $458 per square foot against a peer median ask of $454. The gap to the peer median sold price over the last 12 months is $60,000.
Petaluma Posts $113.7M Quarter With a $3.4M Ceiling and a Median That Climbed $80K by September
109 closings across Q3 2026 generated $113.7 million in total volume. The headline number is a single Michelle Lane sale at $1,294 per square foot — but the more durable story is in how the market behaved differently at each price tier.
Emma Way paid $51,000 over ask — yet it wasn't September 29's biggest premium
The day's clearest signal came from the recorded closings: two of three single-family homes sold above their list prices, while the third closed $20,000 short. Three more went pending and two new listings hit the MLS.